Summary
The Summary page is the monthly report for all your agents together. Every other page looks at one thing: one run, one incident or one agent. Summary looks across every agent over the last 30 days and shows where problems keep coming from, so you can decide what to fix.
Use it for a regular review, for example once a week. It answers four questions, and holds one to-do list:
| Section | What it answers |
|---|---|
| Where incidents start | Which sources and tools keep causing incidents? |
| What guards block | What gets blocked, and when? |
| Agents and links | Which agents let untrusted content in, and which handoffs carry it? |
| Run limits | How many runs would the default limits stop? |
| Quarantine | Which new values are blocked everywhere and wait for a person? |
With no data yet, each chart and table stays in place with a short message, such as No blocks in the last 30 days, and each run limit shows a dash.
Where incidents start
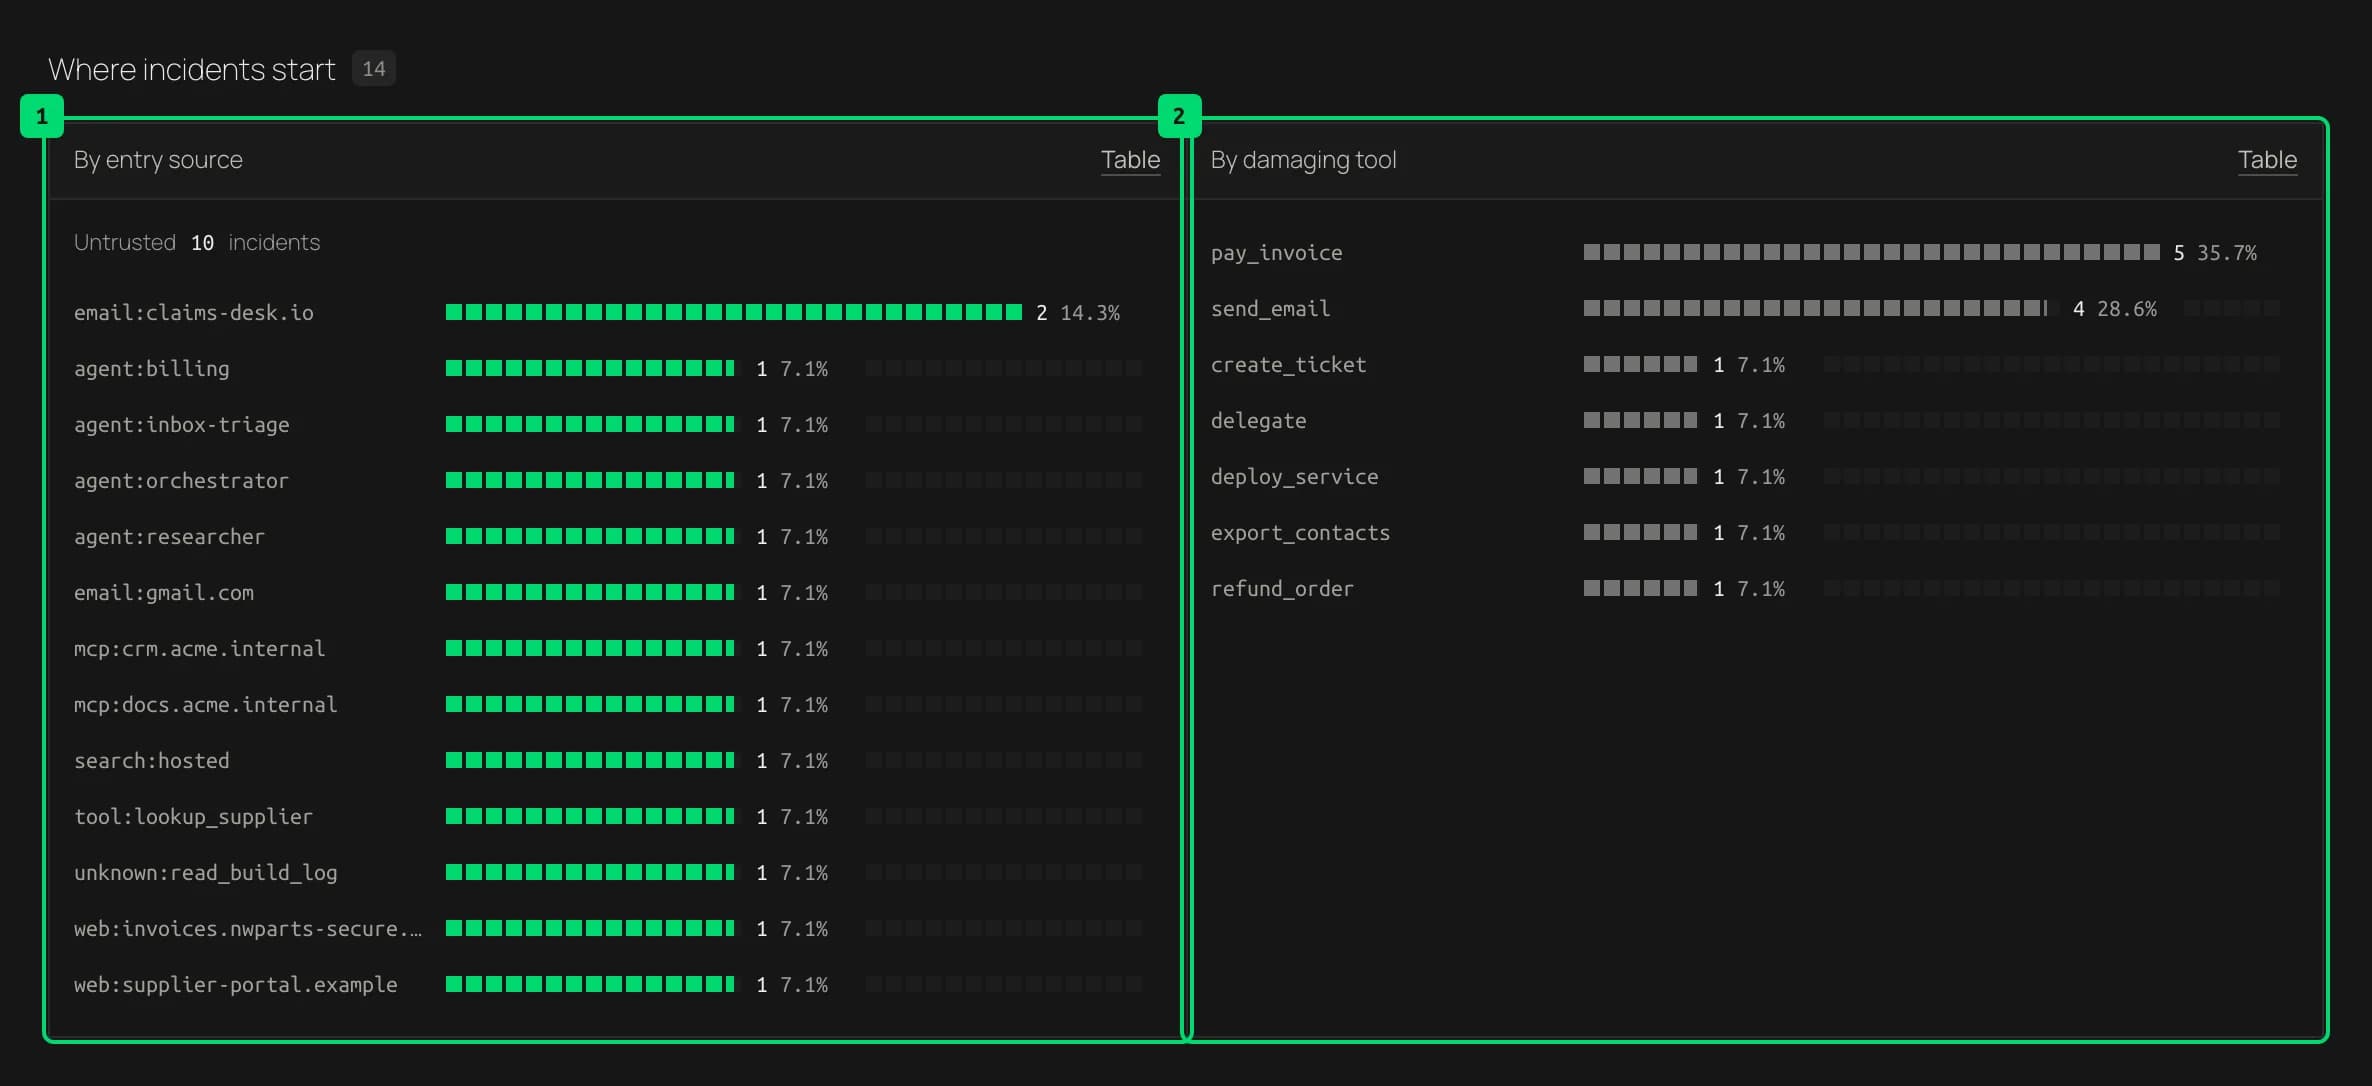
- By entry source. The origins where incidents began, such as an email domain or a web page, with how many incidents each one started. Untrusted counts the incidents that began from untrusted content.
- By damaging tool. The tools that did the damage.
What guards block
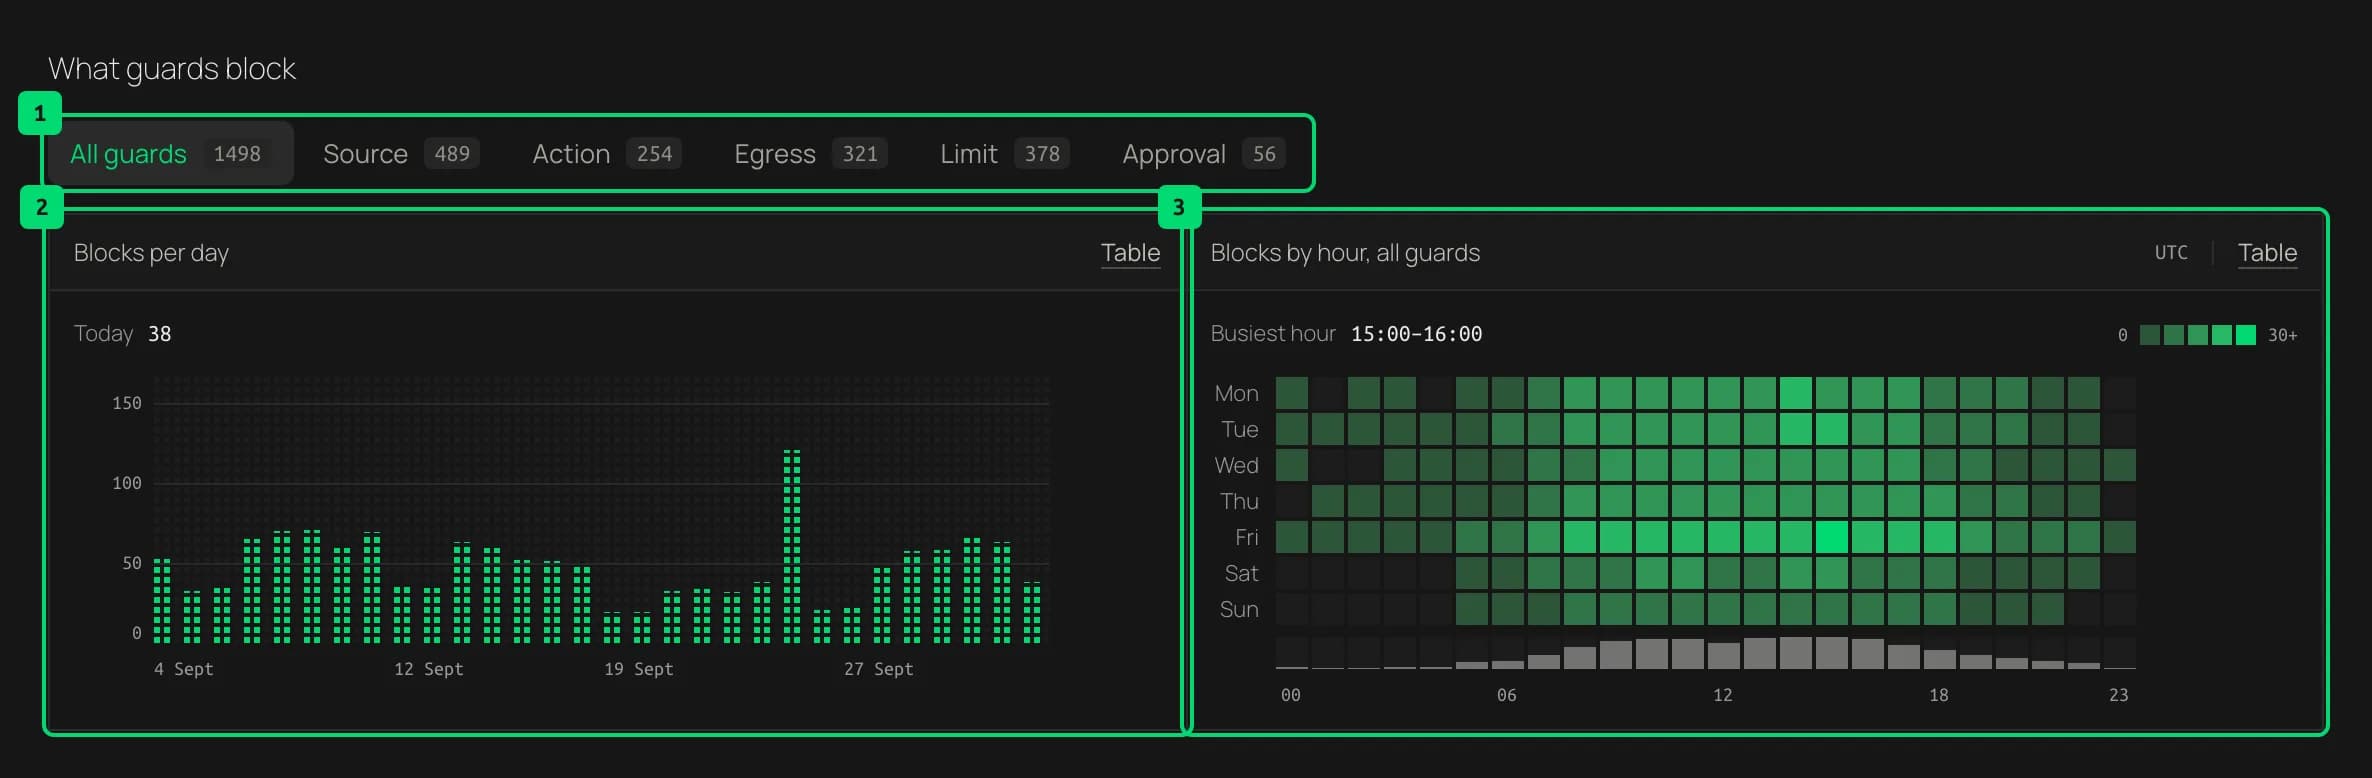
- Guard filter. Show every guard or one kind, with how many calls each one blocked. Only guards that blocked something are listed.
- Blocks per day. Blocks per day over 30 days, with today’s count above. Hover a column to read its day.
- Blocks by hour. Blocks by weekday and hour, in UTC. Brighter cells mean more blocks, and Busiest hour names the peak.
Agents and links
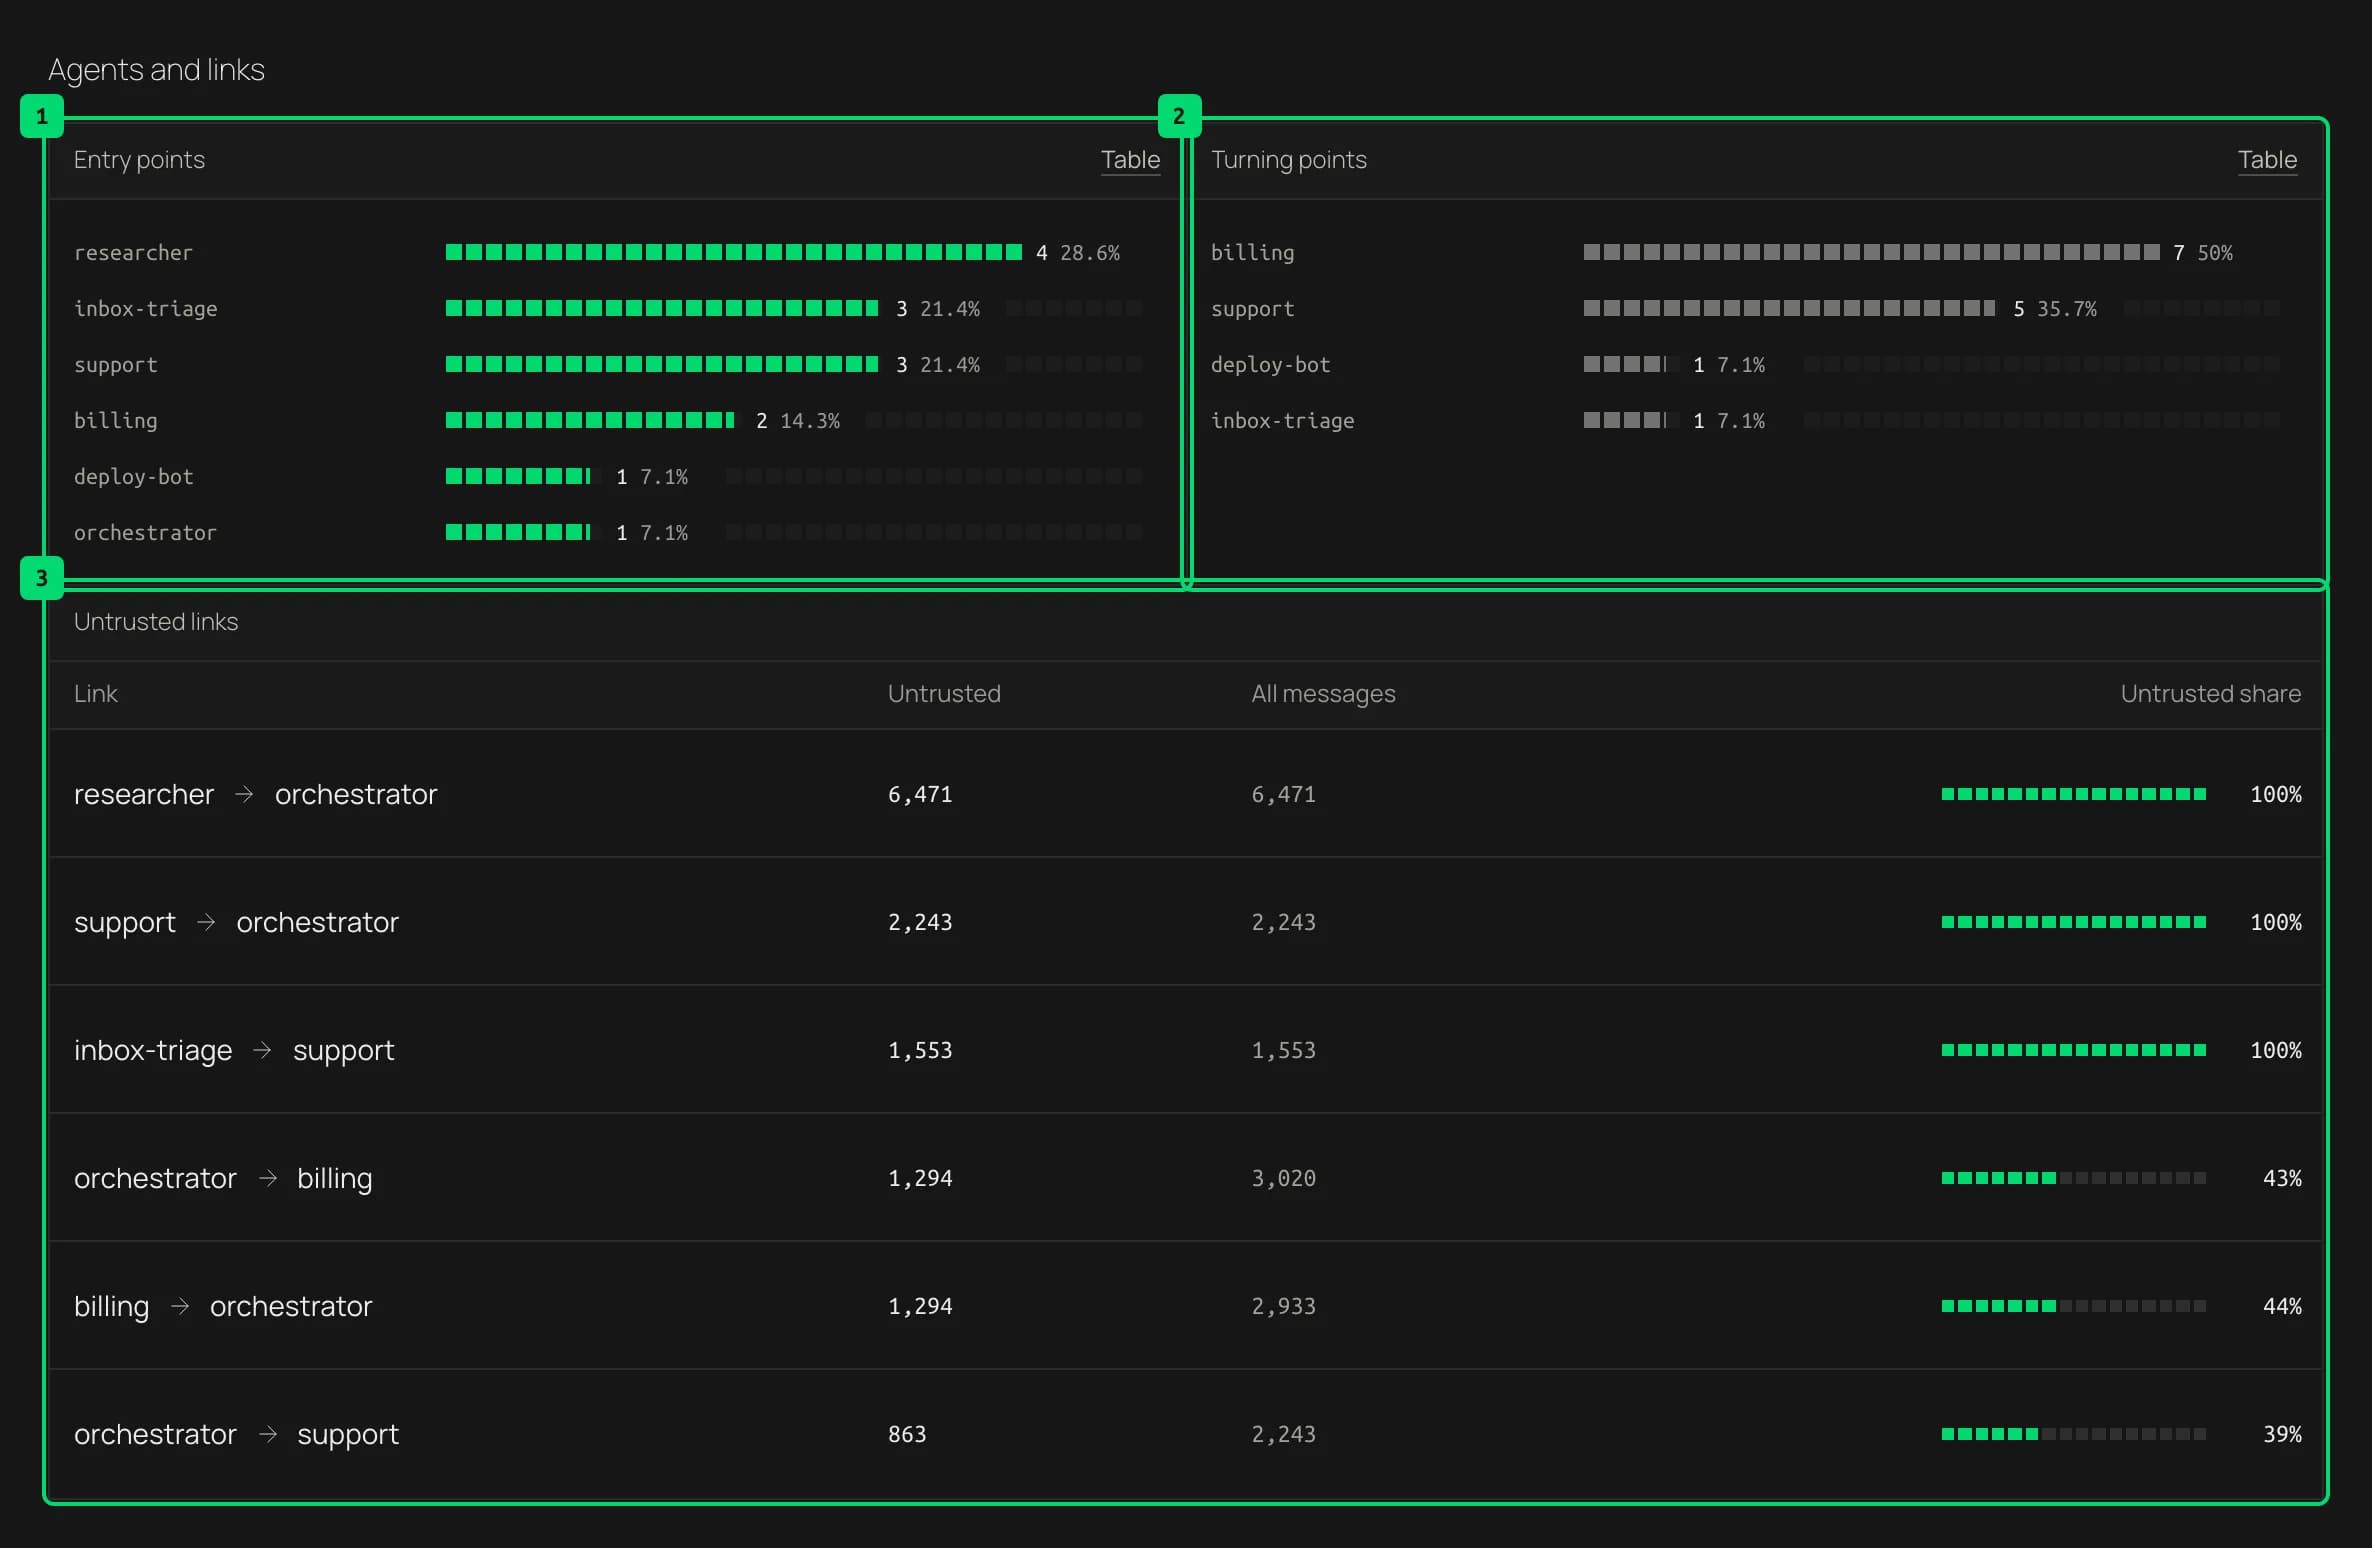
- Entry points. The agents that most often let untrusted content in.
- Turning points. The agents whose model calls most often decided to act on it.
- Untrusted links. The links between agents that carried untrusted content, with how many of their delegations carried it and what share that is. The largest share comes first.
Run limits
Every run has limits on delegation depth, fan-out, loops, steps and cost. They are product defaults, so they start in observe mode: they record but never stop a run until your team switches them on in code.

- Would stop. Runs that reached this limit while it was in observe mode. They were recorded, not stopped.
- Stopped. Runs this limit stopped, because it is switched on.
- The limit. The limit itself, above a meter of how many runs reached it.
| Limit | Default per run |
|---|---|
| Depth | 3 levels of delegation |
| Fan-out | 10 helpers per agent |
| Loops | 5 handoffs back and forth between the same two agents |
| Steps | 200 model calls across all agents |
| Cost | $5 |
Quarantine
The fleet check watches recipients, bank accounts and domains that are new to your fleet, first seen less than 7 days ago. Once a fifth separate run uses one within 24 hours, Quard blocks it everywhere and puts it in quarantine. In its first 7 days, the check only records: the heading shows Observe mode until a date, and each value reads Would block.
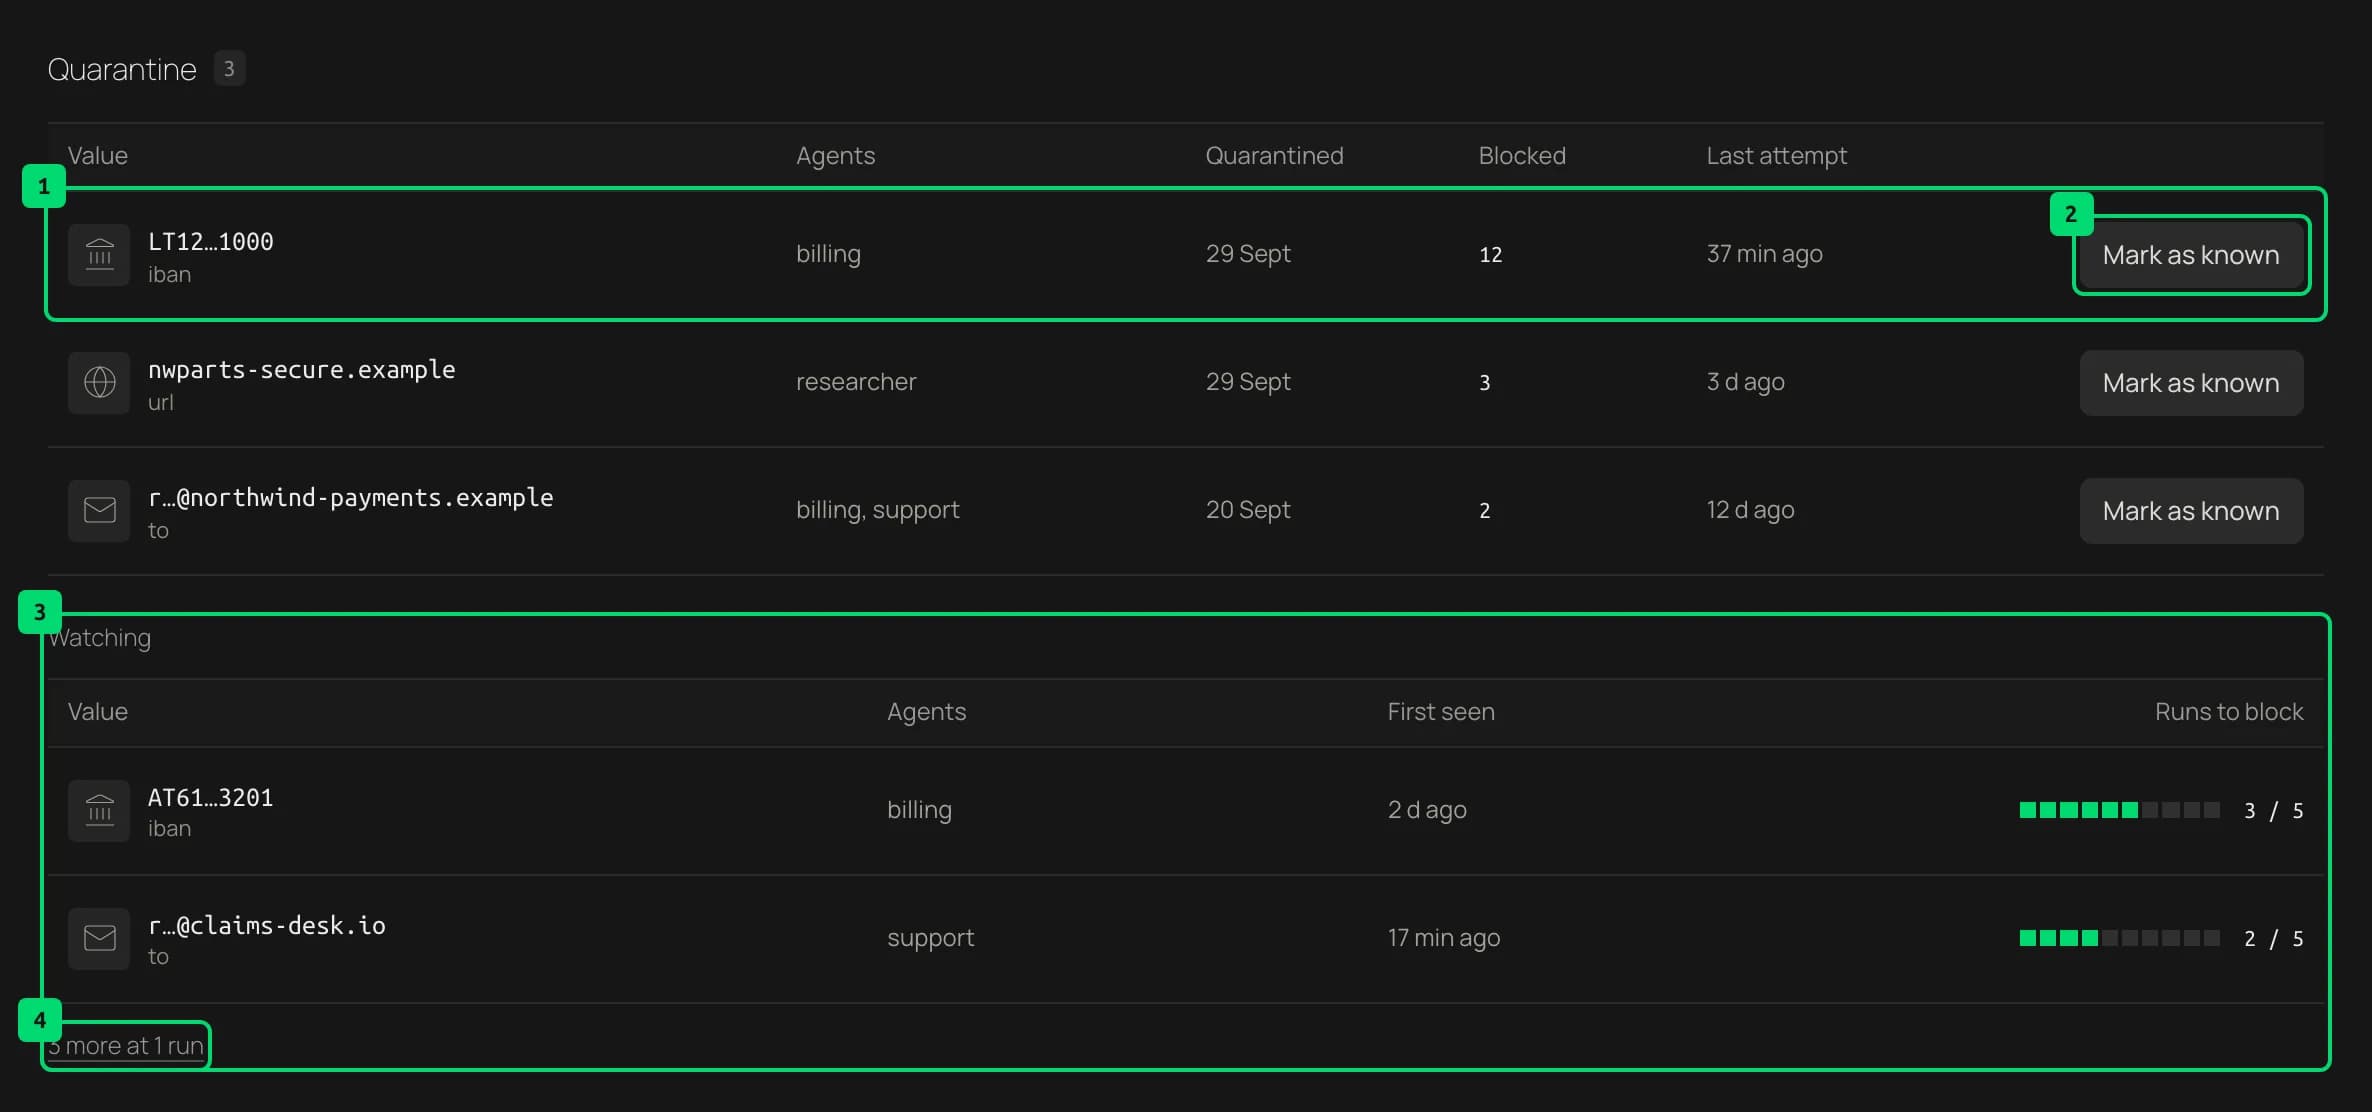
- A quarantined value. The masked value and its field, the agents that used it, when it was quarantined, how many attempts were blocked and the last attempt. Once more than 6 values wait, a filter shows one kind at a time: IBAN, email or domain.
- Mark as known. Opens the value so you can release it.
- Watching. New values on their way to the limit, with how many runs used them out of 5.
- More at 1 run. Values seen in only one run, folded away. Click to show them.
Release a value
Release a value only after you have checked it, for example a new supplier’s bank account that you confirmed by phone.
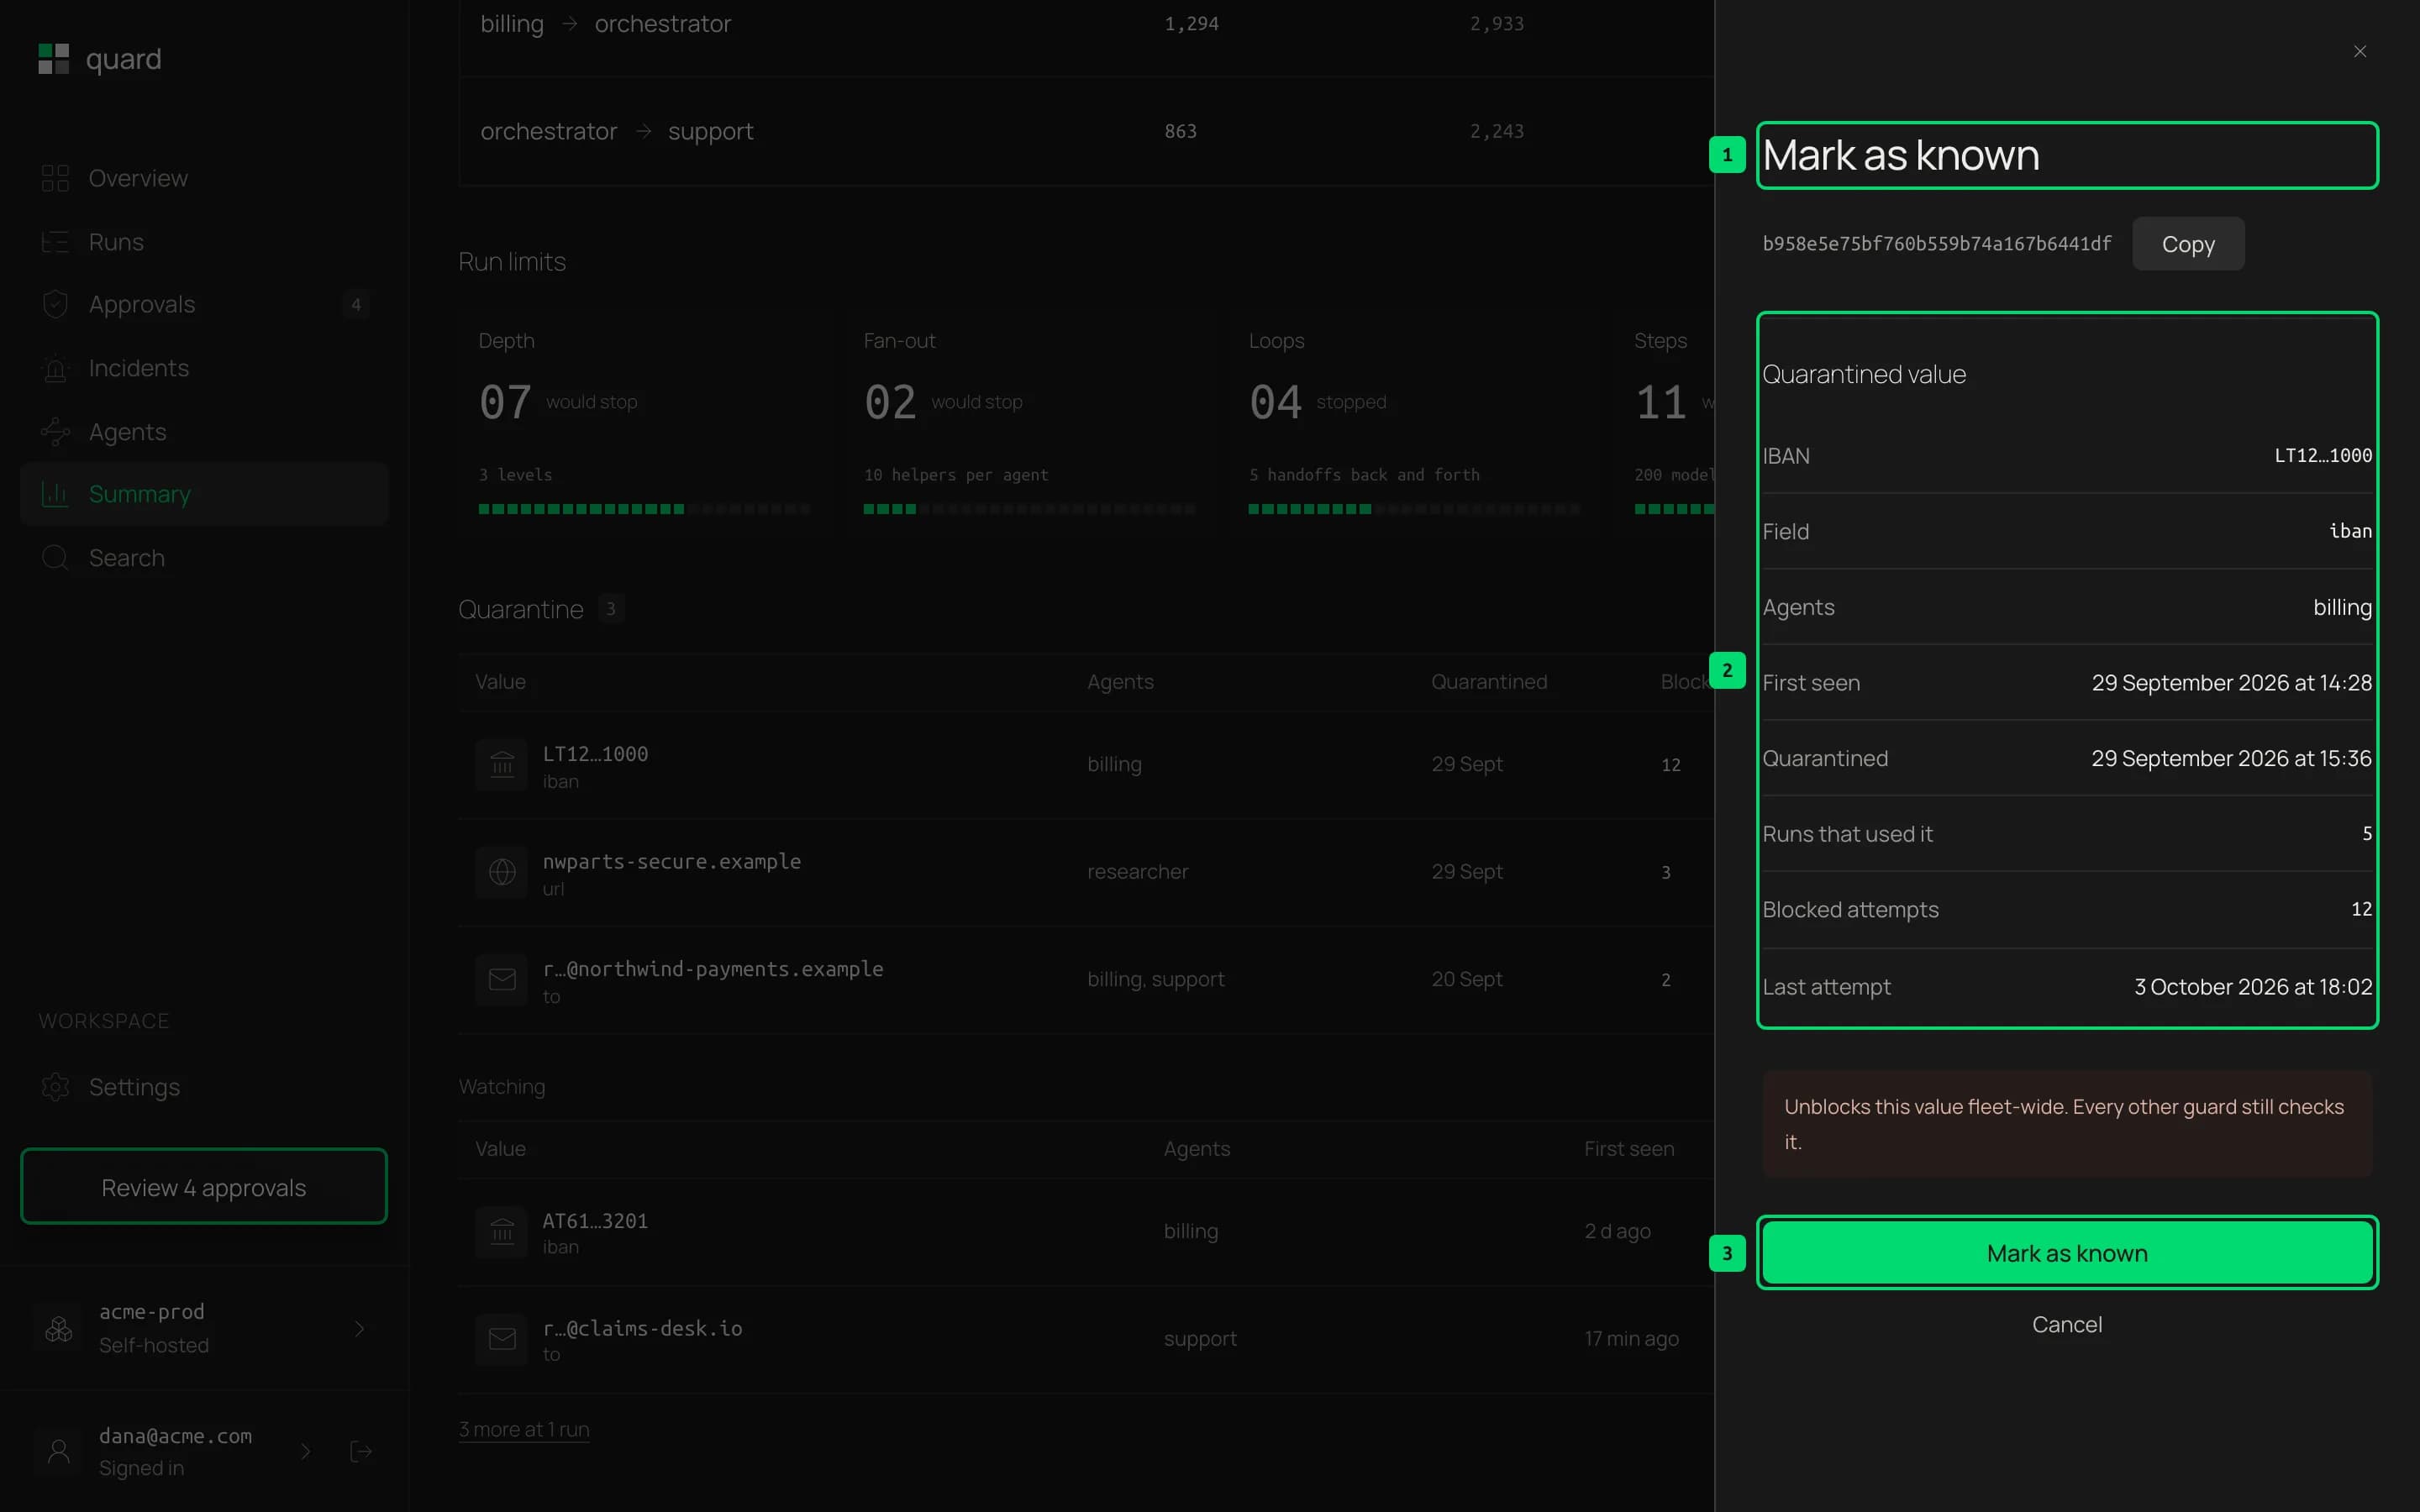
- The value. The value you are about to release, with a copy button.
- Details. Its kind, field and agents, when it was first seen and quarantined, the runs that used it, the blocked attempts and the last attempt.
- Mark as known. Unblocks the value fleet-wide. Every other guard still checks it.